Hardness testing by means of regression analysis
Non-destructive hardness testing with eddy current devices is an established method in many production facilities. The quality attained of the measurement data recorded during the test provides meaningful input for further evaluations.
In many production processes, the requirements for cycle times and surface properties of the components are so high that established measuring methods are not used for hardness measurement. Either the measuring options are so complex that the integration into production processes is not profitable or the measuring times are too long.
This has promoted the further development of eddy current testing devices for non-destructive hardness testing and allowed them to mature into an established and standardized procedure. Eddy current-based hardness testing systems have the decisive advantage that they do not measure at specific points on a surface, such as hardness measuring devices according to the Vickers or Brinell method, but rather measure across the entire test specimen.
Also, the variation of the frequencies can be used to determine if the test specimen is to be checked close to the surface or further in-depth. In addition to the basic frequency of the eddy current response, the process settings also evaluate the harmonics, which provide additional information about the hardness or alloy.
Learn more about hardness testing with eddy current. Read our eBook about challenges and solutions for hardness testing. Click here!
With the hardness measurement, the user mostly records and processes numerous measured values, based on which he determines the conformity of the component with the requirements.

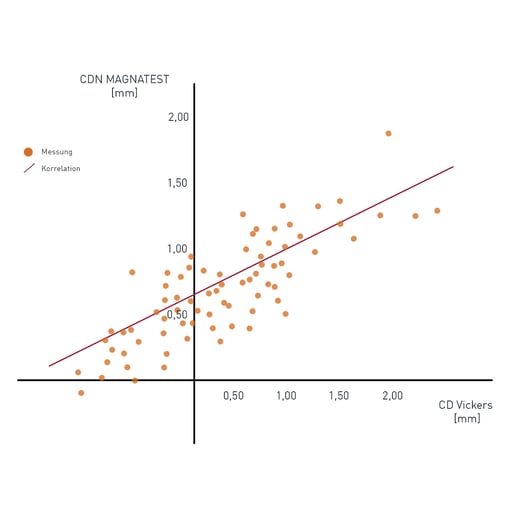
Correlation of a defined hardness measurement according to Vickers with measured values from the eddy current tester MAGNATEST
Data in the eddy current based hardness test
In most cases a test includes the checking of several frequencies with different parameter settings. Multidimensional parameter space is created, via which a trend analysis with an SPC (statistical process control) system can be generated in addition to the good or bad part decision. This information enables the user at an early stage to recognize if the process is changing. If necessary, parameters in the process can quickly be adjusted and rejects can be avoided.
Relation of eddy current testing to physical hardness measurement
The disadvantage of hardness testing with eddy current testing systems is the lack of reference to physical or standardized value. The eddy current devices, therefore, do not provide comparable measured values, for example in HRC. The presentation of process quality in a comparable unit is now widespread among process engineers. The specification limits for component hardness are usually indicated with a reference value.
In many productions, therefore, in addition to series testing, a measurement is carried out with an established hardness measurement process to randomly record a reference value with a comparable unit. Regression analysis allows eddy current testing devices to be calibrated by correlating measured values from the eddy current testing systems with a defined hardness measurement.
The regression analysis assigns different specimens to different hardness values. For this purpose, the material and the dimensions of the test specimen must correspond to the components for which the regression analysis is used.
For the regression analysis, each test specimen is measured with the eddy current test system using a setup close to serial production, and a correlation of the eddy current measured values with the hardness properties of the test specimen is recorded (see diagram below). The reference hardness values of the example specimens are recorded using a procedure based on standardized hardness sizes.
From this regression curve, a mathematical description can be derived which is applied to the test in serial production. With this method, an eddy current test device delivers the functionality of a measuring device.
To prevent the drift effects of the test devices, it is advisable to accompany this regression analysis in production with a sample analysis accompanying the series with an additional hardness measuring device. For this purpose, for example, the regression relationship of the test system is verified in every production shift and as part of an annual recalibration.

FOERSTER customers are already using this method in combination with the MAGNATEST D in the production of the automotive industry. In his feedback, a customer enthusiastically described the measurement methodology as superior to the verification during production by Vickers measurement. The latter is used very locally. Inhomogeneities can easily lead to a larger spreading range.
Share this
You May Also Like
These Related Stories

Simplify Your NDT Workflow: Multi-Test Inspections in a Single Platform

Why is demagnetization becoming an ever-increasing necessary process?

